Ditch the survey data!
Interpret your UI/UX research findings by watching and understanding your website visitor’s user behavior. Get both qualitative and quantitative data from ReplayBird.
Benefits
 Save Time
 Instantly capture and analyze behaviors as they happen in real-time.
 Enhanced User Experience
 Gain comprehensive customer insights for a complete understanding.
 Boost Revenue
 Identify emerging possibilities to drive revenue growth
 Customer Satisfaction
 Remove barriers and delight customers with effortless interactions.
 Pinpoint and Resolve Bugs
 Effectively address, troubleshoot, and resolve problems for prompt resolution.
 Privacy-Driven Integration
 Prioritize privacy and secure integration for driving continuous innovation.
Want valuable insights to make your research easier?
Understand your potential end user’s behavior better and discover insights into their pain points and needs with a reliable digital user experience.

Watch your website functioning from your user’s point of view
Analyze front-end errors with replaybird session replay to know your potential digital user’s pain points. Session replay reveals the whole screen of your user with detailed behavioral data.

Track and analyze Quantitative behavioral and Qualitative attitudinal metrics.
Get the clearest view of a design problem by combining quantitative and qualitative research along with attitudinal and behavioral approaches.
Get your free trial now!
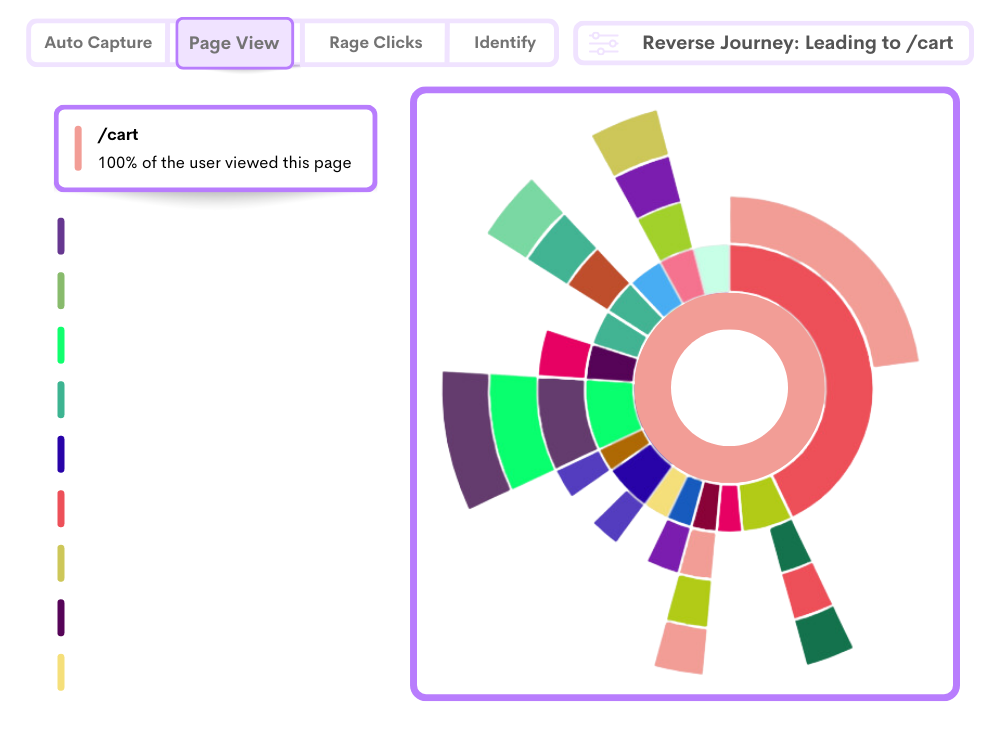
Observe user journeys to understand patterns and trends
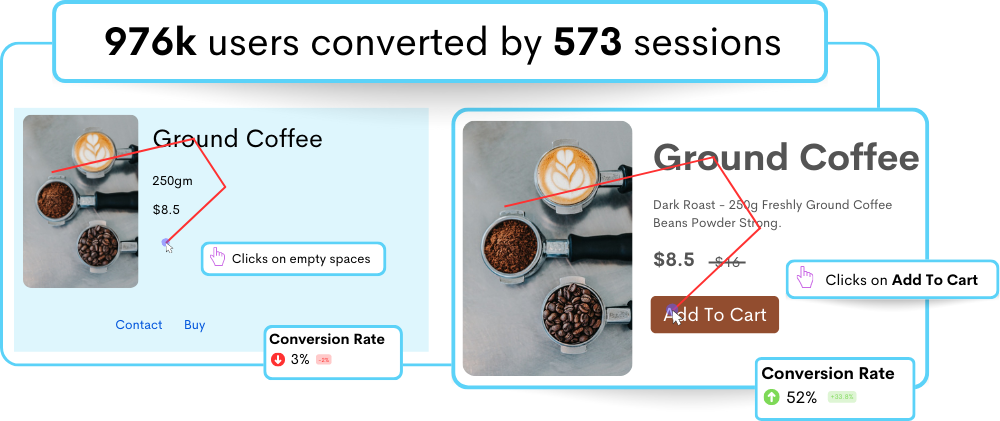
Get insights on actions like mouse movements, clicks, rage clicks, keyboard actions, navigation from one page to another, and much more. Give a splendid user journey without errors to boost your conversion rate.
Go from insight to action
Conversion rate optimization
User engagement tracking
Customer support
App Analytics
Usability testing
Website tracking
UX design issues
Marketing funnels
Application debugging
Performance marketing
Product experience insights
Engagement patterns
Better Insights. Grow Faster.
Ready to understand your customer journeys like never before?
Frequently Asked Questions
It provides a detailed playback of the user's experience, including clicks, mouse movements, and scrolling. Here are some of the benefits of using session recordings in product or user experience research:
- Understanding user behavior: Session replay provides researchers with a detailed view of how users interact with a product or website, helping them to understand user behavior and identify areas for improvement.
- Enhance the user experience: By analyzing session recordings, researchers can identify pain points in the user experience, such as confusion or frustration, and make changes to improve the overall experience for users.
- Enhancing collaboration: Session replay can be shared with designers, developers, and other stakeholders, providing a common understanding of user behavior and helping to facilitate collaboration on improvements to the product or website.
- Validating design decisions: Session recordings can be used to validate design decisions, such as the placement of buttons or the use of certain color combinations, by observing how users interact with these elements in real-world scenarios.
- Identifying technical issues:Session replay can help researchers identify technical issues, such as bugs or broken links, that may be affecting the user experience.
- Product analytics: Product analytics that provides a visual representation of user behavior on a website or application.
- Surveys: Surveys provide a quick and cost-effective way to gather data from a large number of users, but they are limited in their ability to provide a detailed understanding of user behavior. In contrast, session replay provides a visual representation of user behavior, which can be more insightful and help researchers better understand user needs and motivations.
- Usability testing: Usability testing is a valuable method for evaluating the ease of use of a product or website, but it typically involves a small number of participants and can be time-consuming and resource-intensive. On the other hand, session recordings can be conducted on a larger scale and provide a more detailed view of user behavior, including mouse movements and scrolling patterns, which can help researchers understand user behavior in greater depth.
- Heat maps: Heat maps visually represent how users interact with a website or application, but they do not provide a detailed view of user behavior like session replay does. Heat maps are useful for understanding overall patterns of behavior, but session recordings provide a more detailed view of individual user sessions.
- A/B testing: A/B testing compares two versions of a product or website to determine which one is more effective. While A/B testing can provide valuable data on user behavior, it is limited in its ability to provide a detailed understanding of why users behave in a certain way. Session replay, on the other hand, provides a complete picture of user behavior, including clicks and mouse movements, which can help researchers understand the reasons behind user behavior.
By collecting and analyzing data on user behavior and usage patterns, product analytics can provide valuable insights into which features are being used most frequently and which are having the biggest impact on user satisfaction and engagement.
By using product analytics, companies can gather data on user behavior and usage patterns and use this information to segment their customer base into smaller, more manageable groups.
For example, product analytics can track which features are being used most frequently by different groups of customers, and this information can be used to segment customers into groups based on their level of usage.
Companies can then use this information to target each segment with tailored messaging and experiences, increasing the relevance and effectiveness of their marketing efforts.
In addition to usage data, product analytics can also be combined with other data sources, such as customer demographics or purchase history, to provide a complete picture of customer segments and their needs and behaviors.
By analyzing the performance of each step in the funnel, companies can better understand where customers are dropping off and identify areas where they may be encountering pain points.
- Identifying problem areas
- Prioritizing research initiatives
- Measuring the impact of changes
- Understanding customer behavior
- Optimizing customer journeys
With error tracking, developers can quickly identify when and where an error occurs, along with any relevant details, such as the parameters and environment that were present at the time.
This information can then be used to isolate the cause of the error, which is a critical step in root cause analysis.
Error tracking tools often provide features such as grouping similar errors together, tracking the frequency and severity of errors over time, and notifying relevant team members when new errors occur.
This helps to prioritize errors so that the most critical issues can be addressed first and also helps to prevent errors from being overlooked or forgotten.
Error tracking solutions can give insights into which issues are impacting the most users or having the most influence on the application's performance by recording the frequency, severity, and other important aspects of errors.
This data may then be used to prioritize bug solutions based on the severity of the problem. For example, an error that causes the program to crash for a large number of users is likely to be prioritized above an issue that affects only a few users and has a modest impact on performance.
Error tracking tools can also be configured to send notifications when new errors occur, or when the frequency or severity of an error changes, allowing teams to quickly respond to critical issues.
Try ReplayBird for free now
Free 14-day trial. No credit card required. Easy setup.